Select a project below to jump straight to the technical breakdown and interactive report.
Serverless GCP + Gemini AI pipeline turning raw photos into structured eBay listings.
Interactive Power BI dashboard tracking 8.3M+ financial complaints.
Power BI dashboard tracking 52K+ calls against Service-Level targets.
Multivariate Python analysis of 100K+ passengers to find what actually drives loyalty.

Serverless Data Engineering & Applied AI
Databricks
Streamlit
Power BI
An end-to-end e-commerce data pipeline that turns raw, unsorted product photography into ready-to-list eBay inventory with no manual data entry involved. Photos are batched, segmented, and sent through a serverless AI service that writes the SEO title, condition, description, and pricing for every item automatically.
Photos sync to a Google Cloud Storage bucket and are picked up every minute by a Python service running on Google Cloud Run. Items are separated automatically by detecting a "blackout" divider photo (the lens covered by hand between items) using image-brightness detection. Each item's photos are sent to the Gemini API, which returns a structured listing (title, condition, description, and estimated value/shipping) as clean JSON. The finished listings are then loaded into a Databricks SQL warehouse, managed day-to-day through a custom Streamlit terminal, and tracked in Power BI to compare AI-estimated pricing against what items actually sell for.
Interactive Power BI Dashboard
Databricks API
Power BI
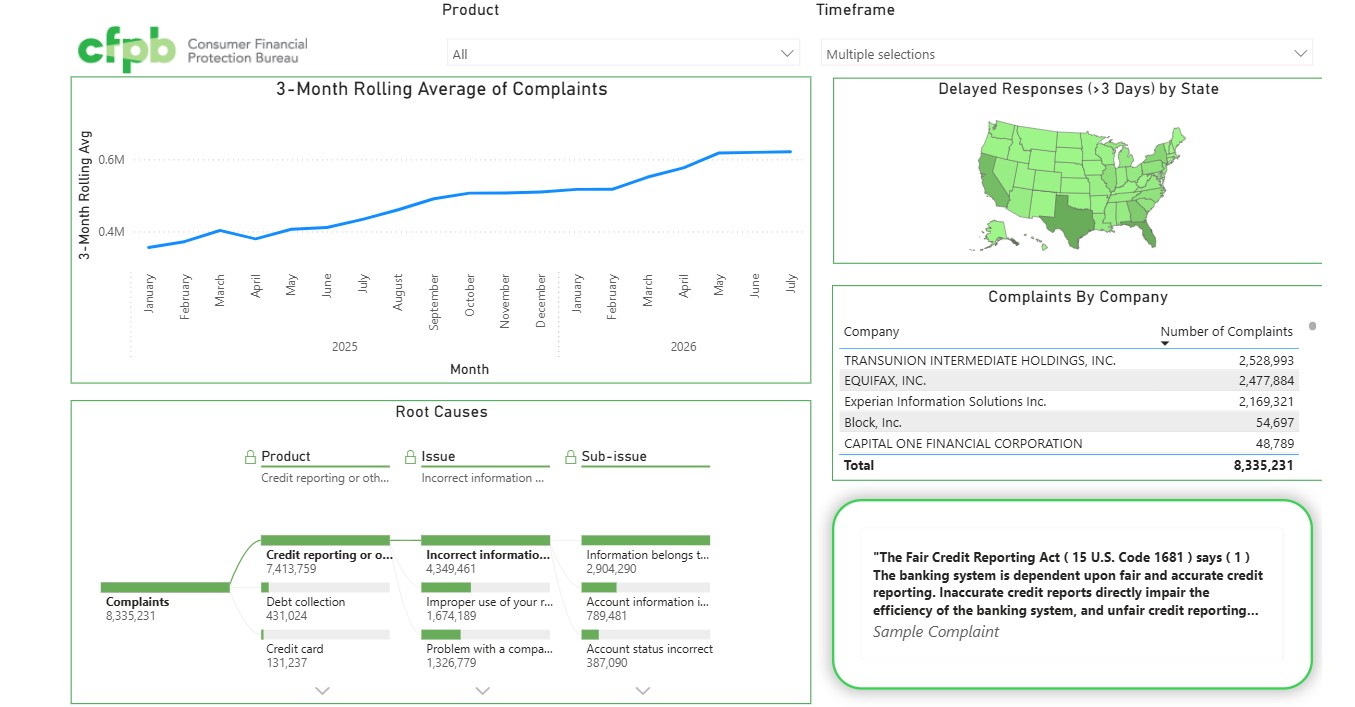
This dashboard provides a comprehensive visual analysis of over 8.3 million consumer complaints filed with the Consumer Financial Protection Bureau (CFPB) between January 2025 and July 2026. By structuring and visualizing this massive dataset, the report identifies systemic issues, geographic pain points, and company-specific trends within the financial sector.
This isn't a one-time export — the report is wired directly into a live data pipeline. New complaint data is pulled from a Databricks workspace via a scheduled API call, then automatically transformed and loaded into the reporting layer. That means the numbers above refresh on their own, with no manual downloads or file handling required to keep the dashboard current.
Interactive Power BI Dashboard
Power BI
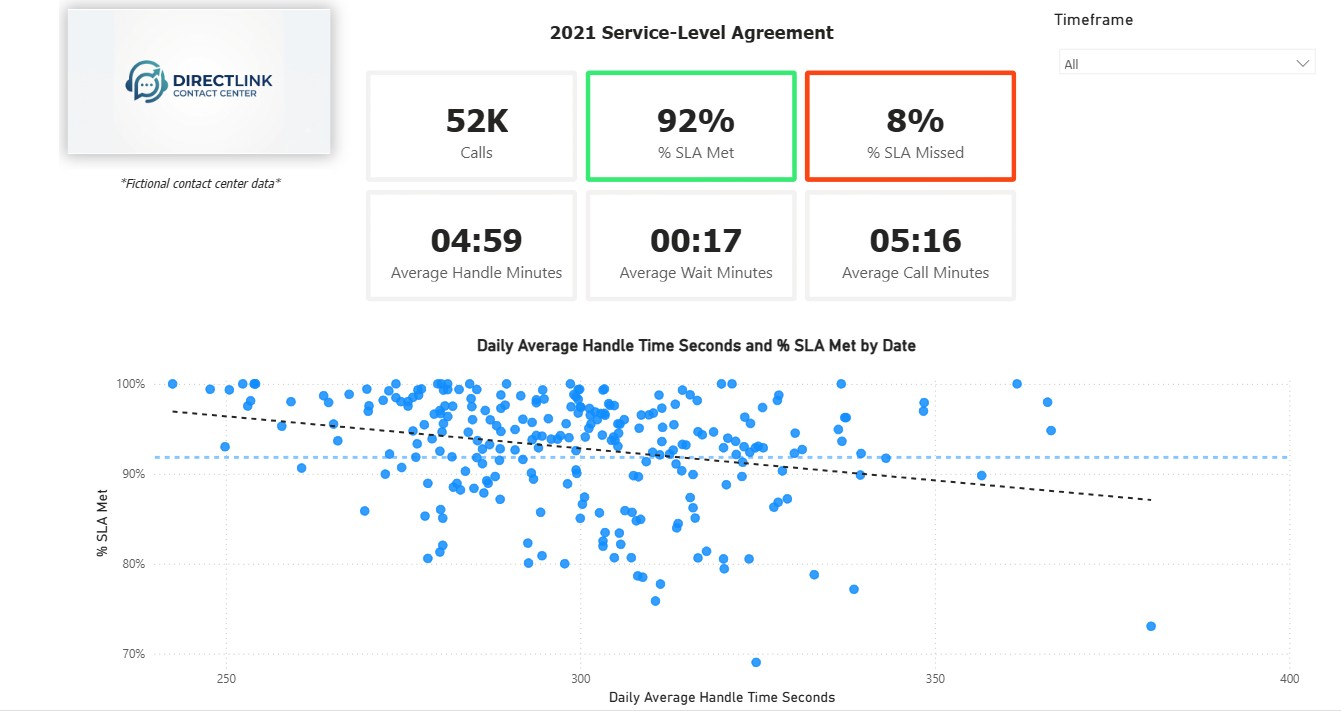
This dashboard tracks Service-Level Agreement (SLA) performance across a contact center's 52,000+ customer calls in 2021. It gives leadership a clear, day-by-day view of how consistently the team is meeting its response and handling targets, and points to where call length is putting that performance at risk.
Unlike the CFPB report above, which pulls automatically from a cloud data platform, this pipeline runs entirely locally, end to end. Raw call records are extracted, cleaned, and loaded using a custom Python-built ELT process into a local database, then modeled and published into Power BI. Without a managed cloud platform doing the heavy lifting, this required hands-on engineering at every stage: scripting the extraction and transformation logic, managing the local database, and scheduling the refresh process — the kind of ground-up pipeline work that goes into building reliable reporting from scratch.
Python / Jupyter Data Analysis
A multivariate exploration of the Airline Passenger Satisfaction dataset (Kaggle), covering 103,904 passenger records across 23 variables. The analysis applies a lens shaped by years of contact center CX work, loyal customers vs. one-and-done customers, what actually separates them, testing service ratings, trip context, and delays against loyalty to see which dimensions actually move the needle.
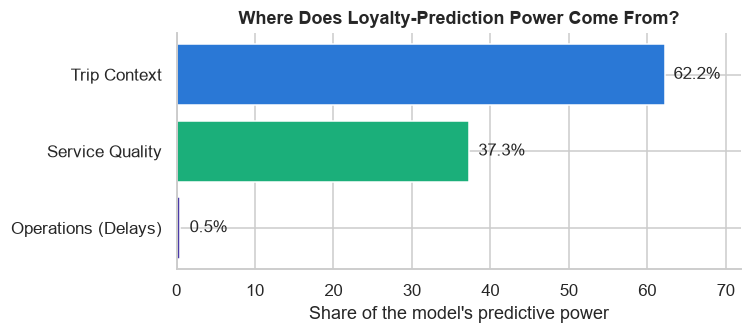
Built entirely in a Jupyter notebook with pandas, matplotlib, and seaborn for exploration, the analysis works through the data in layers rather than jumping straight to a model: first checking whether loyalty simply tracks who's flying, then ranking all 14 service-rating dimensions by the gap between loyal and disloyal customers, then testing operational reliability, before finally training a Random Forest classifier to weigh every factor together. The model reached 94.6% accuracy separating loyal from disloyal passengers.